The carbon footprint of the council and borough
We’ve used the latest emissions data to provide a summary of our operational carbon footprint for the 2025/26 financial year and the 2025 calendar year. We have also provided a summary of the borough’s carbon footprint for the 2023 calendar year.
This shows the progress we are making - guided by our Climate Change and Air Quality Strategy - to reduce our own carbon emissions as we work alongside partners and communities towards a net zero carbon borough by 2045.
We report on emissions under the Greenhouse Gas Protocol, the international standard for calculating carbon footprints. You can request a more detailed report covering our and the borough’s carbon footprint by getting in touch with our climate change team.
Council operational emissions as of March 2026
We report on our emissions annually for each financial year (1 April to 31 March the following year), measuring progress against the baseline year of 2018/19.
Our figures cover emissions from our day‑to‑day operations – like our offices, staff travelling and vehicles – as well as facilities and services run by others on our behalf – like the Basingstoke Aquadrome. They include the carbon absorbed by our parks and green spaces. They also reflect that we buy 100% renewable electricity for our operations, meaning there are no reportable emissions for this energy use as it doesn’t produce any carbon when it is generated (this is called ‘market-based’ emissions reporting).
As of 31 March 2026, our net emissions had reduced by around 60% since 2018/19. They were also down by 9.9% from the 2024/25 financial year, going from the equivalent of 1,626.8 tonnes of carbon in 2024/25 to 1,466.3 tonnes. This was largely due to swapping more vehicles to electricity or a low-carbon biofuel and our leisure facilities using less gas than expected.
Our leisure facilities currently make up around three quarters of our remaining emissions, with the Basingstoke Aquadrome being directly responsible for around 60%. Work is underway to replace the Aquadrome with a more energy efficient facility with a significantly smaller carbon footprint.
| Year | Net greenhouse gas emissions in tonnes |
|---|---|
| 2018/19 | 3,698.7 |
| 2019/20 | 3,297.8 |
| 2020/21 | 1,533.6 |
| 2021/22 | 1,947.7 |
| 2022/23 | 2,209.3 |
| 2023/24 | 2,360.2 |
| 2024/25 | 1,626.9 |
| 2025/26 | 1,466.3 |
The data in the table above is also displayed in the graph below.

Council operational emissions for 2025
We have calculated our council emissions for the 2025 calendar year to determine the progress we made towards the target in our 2019 climate emergency declaration to be carbon neutral by 31 December 2025.
Overall, our emissions in 2025 were equivalent to just under 195 tonnes of carbon, down by 94.6% compared to when we declared a climate emergency.
This reduction is largely due to our action, including making our buildings more energy efficient and powering our vehicles with electricity or a low-carbon biofuel. The figure also reflects the carbon absorbed by green spaces we own and the use of 1,331 offset credits, which are helping to support the planting of new forests in Scotland.
| Year | Rounded net emissions (tonnes of CO2e) |
|---|---|
| 2018/19 | 3,700 |
| 2019/20 | 3,300 |
| 2020/21 | 1,950 |
| 2021/22 | 2,210 |
| 2022/23 | 2,360 |
| 2023/24 | 1,625 |
| 2025 calendar year | 195 |
| Reduction since climate emergency declaration in 2019 - 94.6% | |
Borough-wide emissions for 2024
The most recently available data shows the borough’s greenhouse gas emissions are equivalent to 890.1 kilo tonnes of carbon dioxide. Most borough-wide emissions come from transport and homes.
This is based on government data, which has a 1.5 to two-year time delay in its publication. The latest available data was published in summer 2026 and covers up to 2024.
Overall, borough-wide greenhouse gas emissions have decreased by just over 32% since the baseline year of 2018.
The table and graph below show borough-wide emissions for each year from 2018 to 2024.
| Year | Borough-wide emissions in kilo tonnes |
|---|---|
| 2018 | 1,178.9 |
| 2019 | 1,111.6 |
| 2020 | 971.2 |
| 2021 | 1,021.7 |
| 2022 | 942.2 |
| 2023 | 890.7 |
| 2024 | 890.1 |
The data in the table above is also displayed in the graph below.
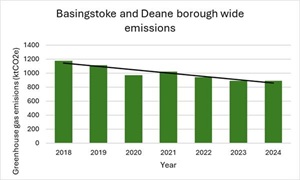
Borough-wide emissions for each year from 2018 to 2024 (opens in new window)
Sign up for email updates
Receive information on council services, news and events by email.
Subscribe© 2026 Basingstoke and Deane Borough Council